


Measure and inspect surfaces optically
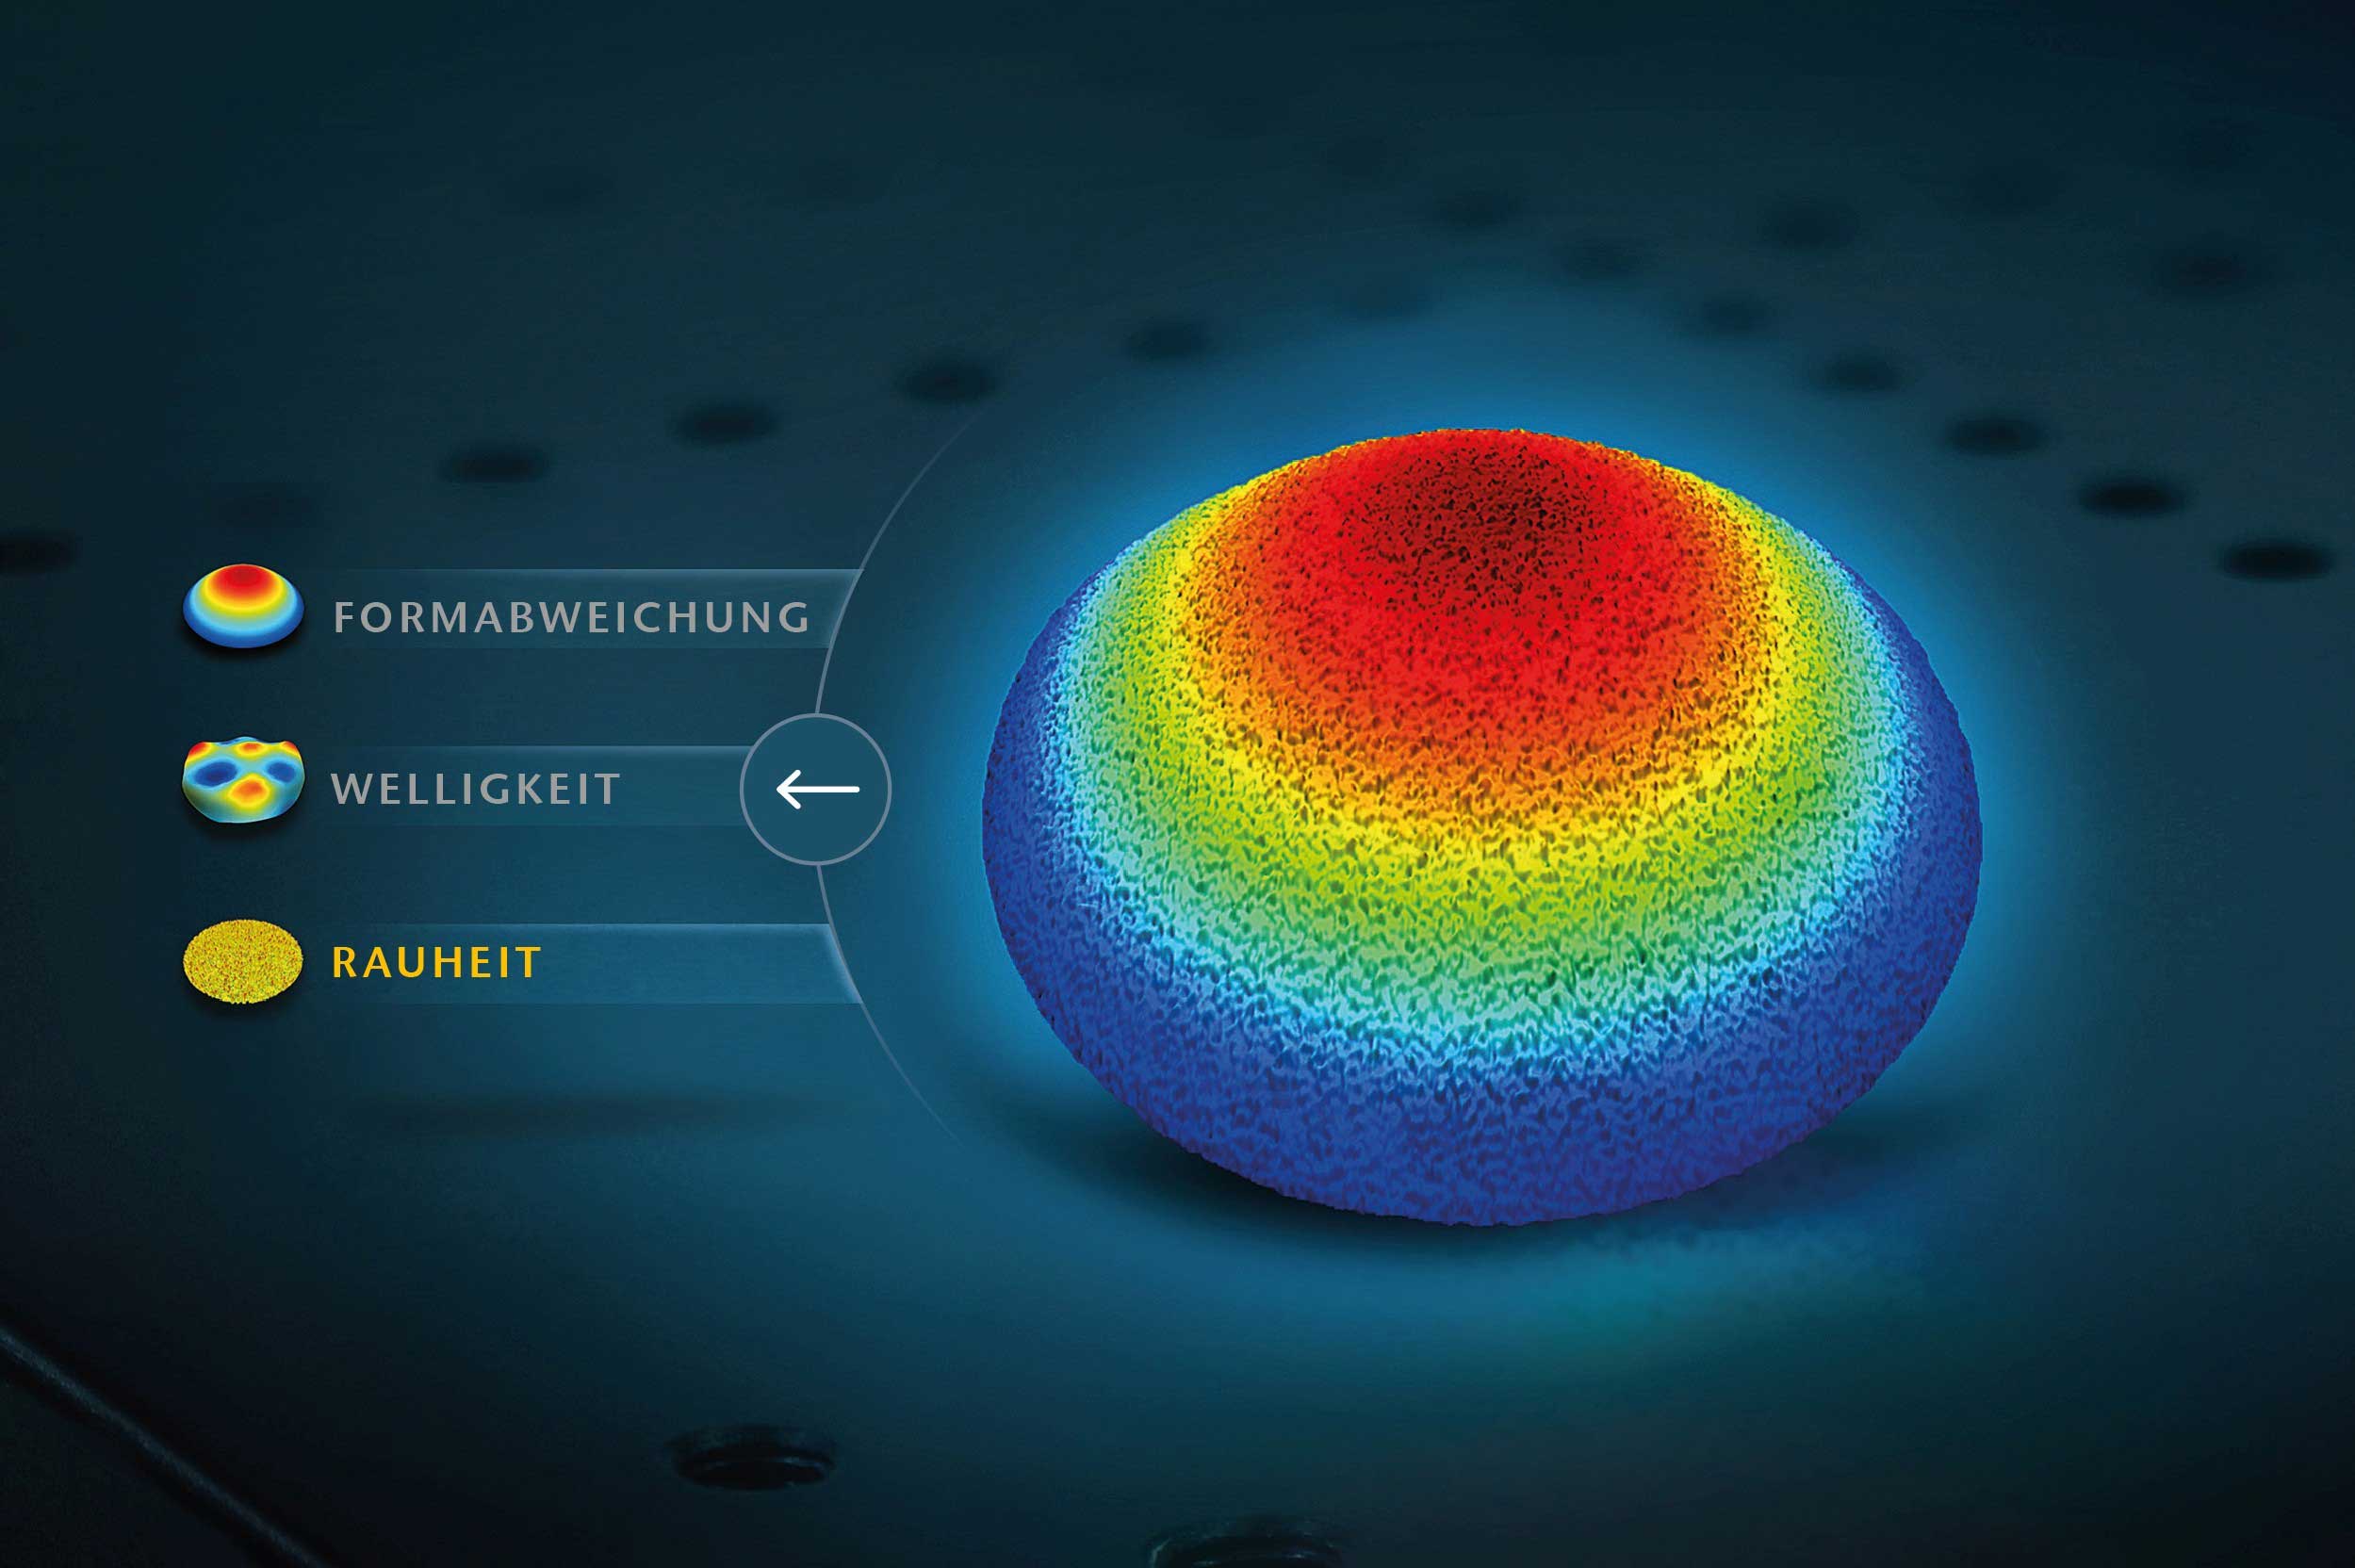
Improving the quality and function of the product by means of optical inline analysis of surfaces.
The surface properties of a product influence its mechanical, electrical or chemical behavior. Only a quality-monitored manufacturing process can ensure the desired result - optical measuring methods open up new and interesting possibilities here.
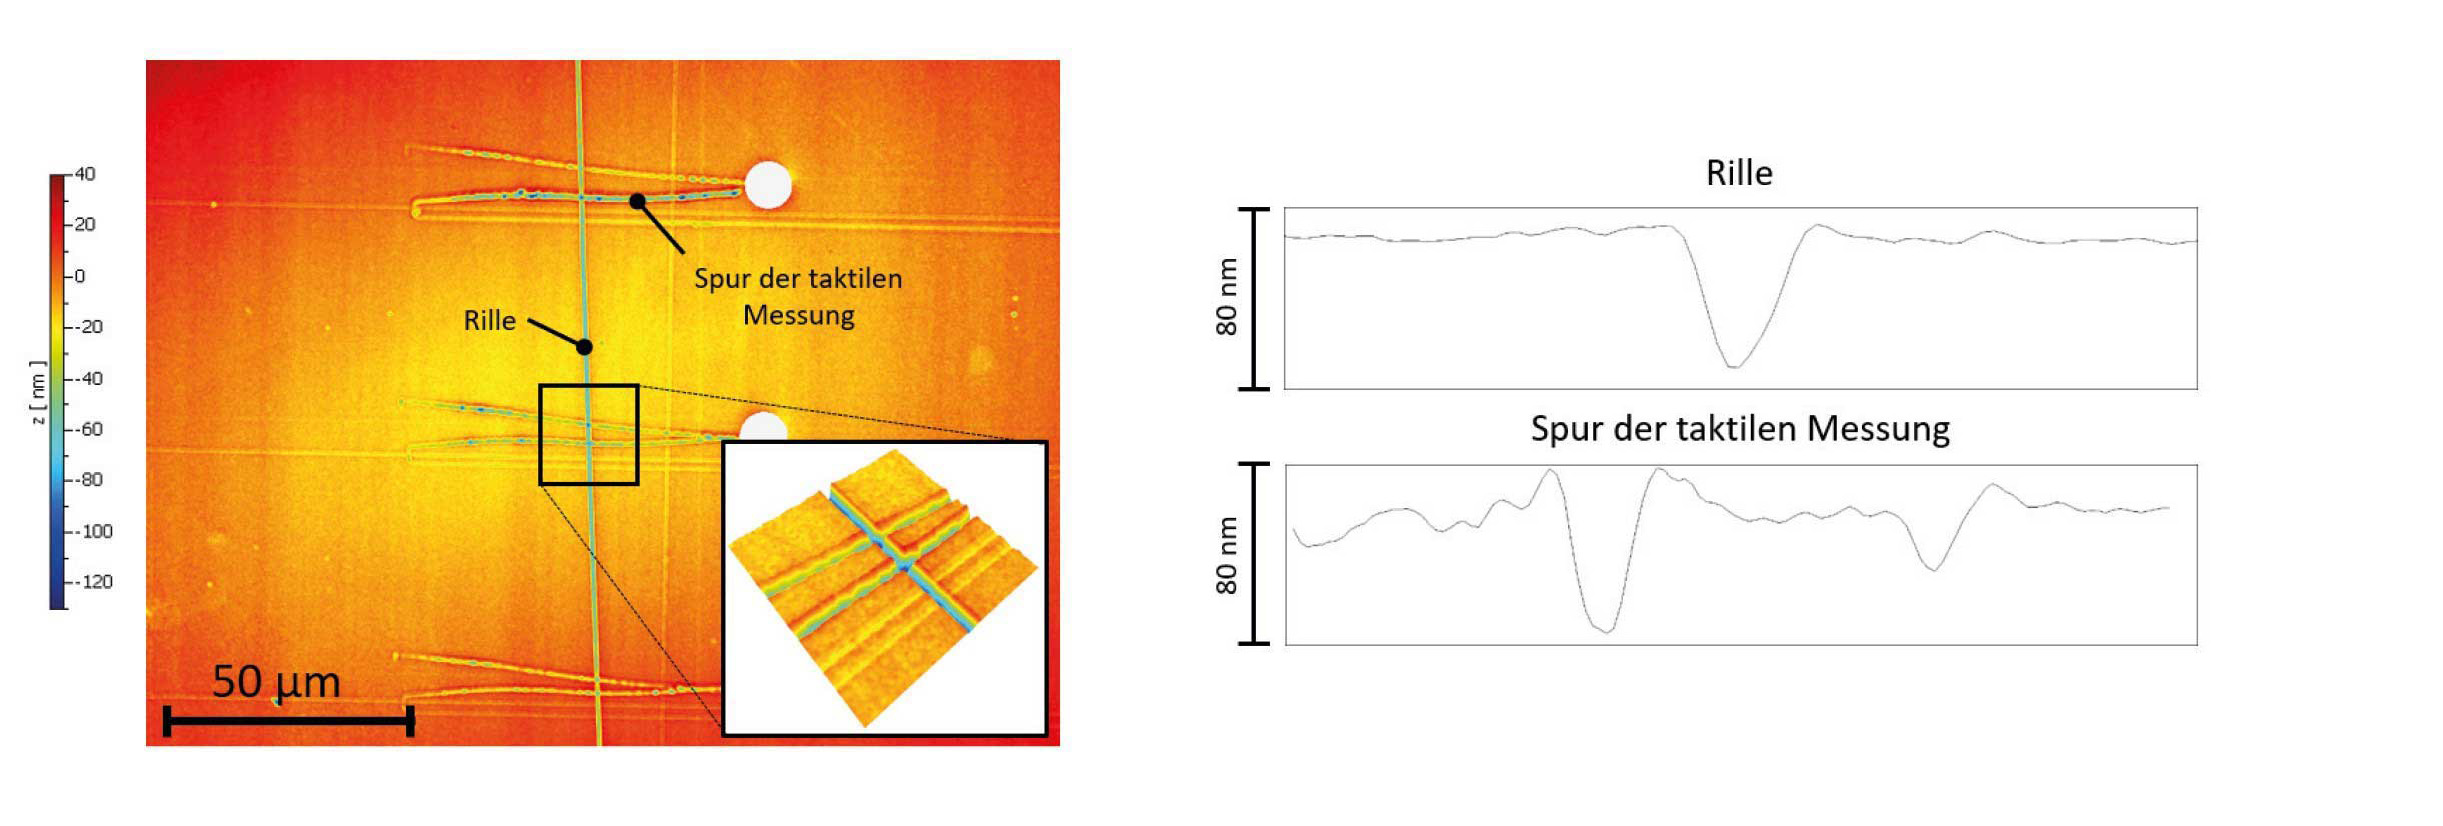
Traditionally, tactile measuring instruments are still used for surface measurements. The so-called stylus method is particularly widespread. Here, a fine diamond stylus tip is guided over the surface and deflected vertically by the surface texture. Information about the surface is thus obtained two-dimensionally along a profile (see Fig. 2). The procedure is described in detail in relevant standards such as DIN EN ISO 3274 or DIN 4287, and has certainly proved its worth in practice. However, the extent to which the reduction of the surface to a profile section provides adequate results depends on the requirements, because the result for the roughness parameter is strongly influenced by the selected measuring position. Therefore, the description of the surface condition as a profile section is usually not sufficient for statements about the functionality of the entire surface or for an optimization of the manufacturing process. This is different with three-dimensional optical measurement, since it can detect over the entire surface. In addition, damage to the surface is ruled out with the non-contact method.
The choice of cutoff wavelength
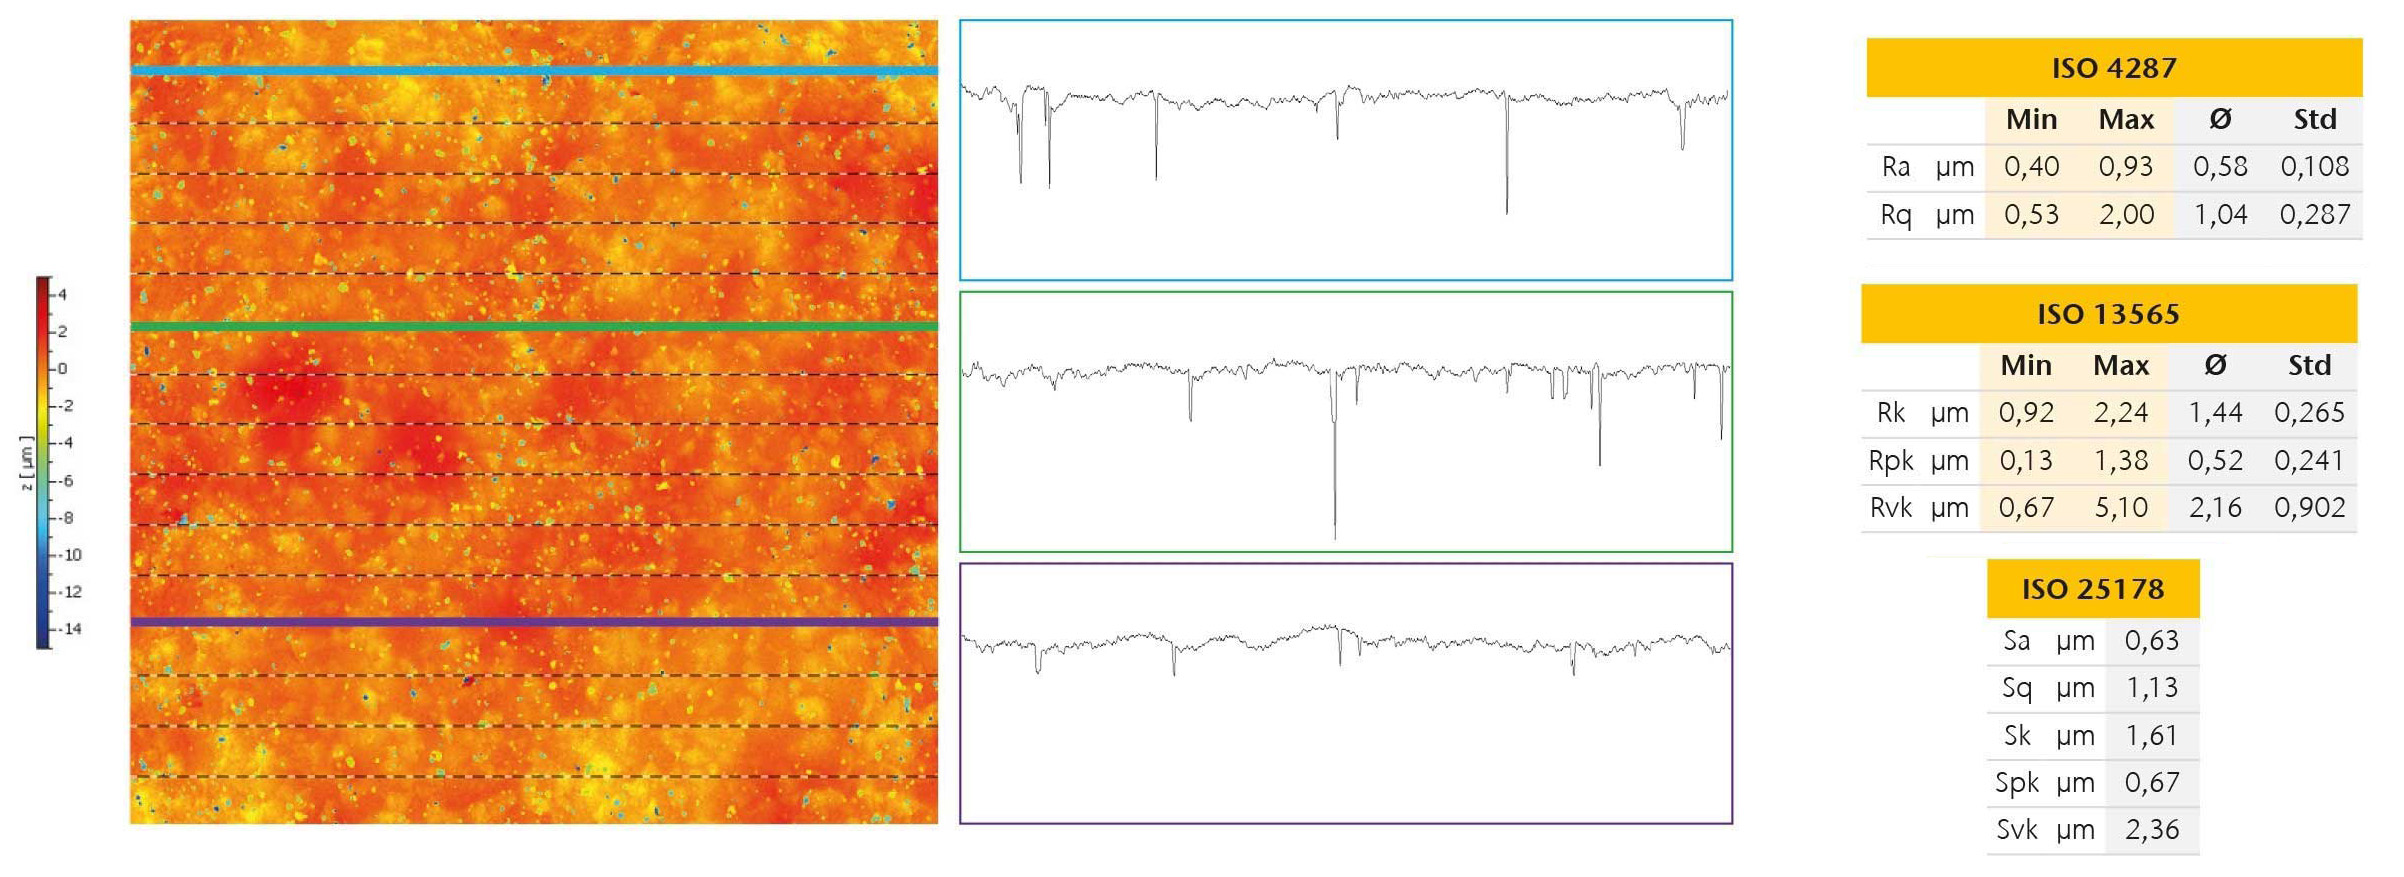
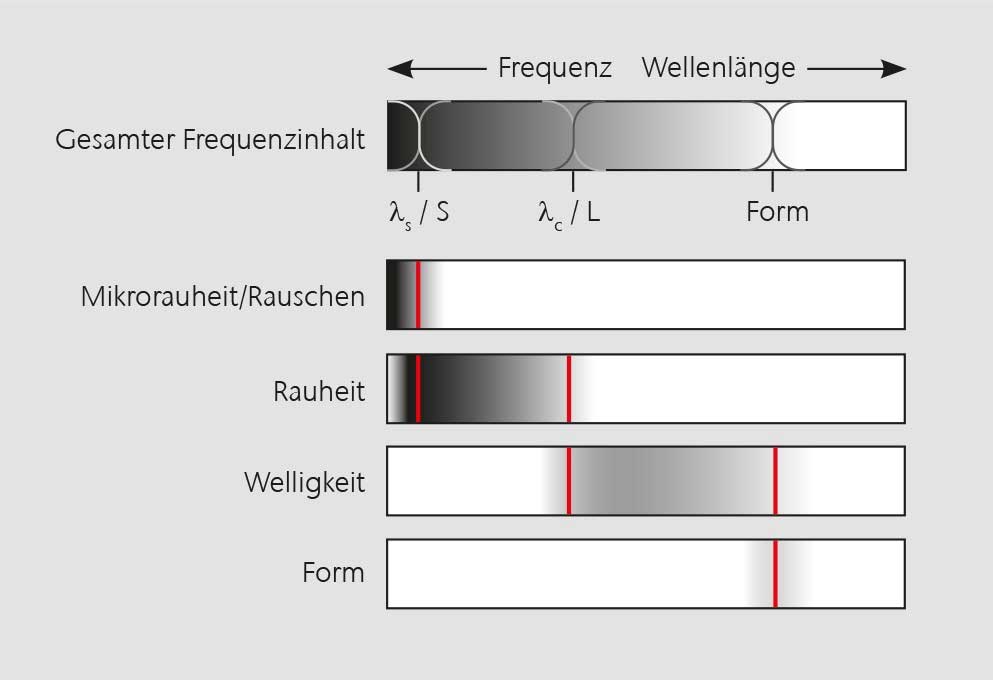
In optical surface measurement, roughness, shape and waviness are not sharply defined features that exist separately next to each other. Instead, a surface can be described as a superposition of numerous wavelengths, with a smooth transition from the particularly long-wavelength shape components to the waviness components and finally to the short-wavelength roughness components (see Figure 4). Frequency filters are responsible for the separation. By using these low-pass or high-pass filters with Gaussian characteristics, a bandwidth-limited profile or a bandwidth-limited surface is then available for further evaluation. The choice of the respective cutoff wavelengths is of central importance, because depending on the setting, different measured values can result for the sought-after measurand. The measurement chains for surface or profile evaluation that can be applied to optical metrology today are described in the ISO 25178 and ISO 4287 series of standards, respectively. In profile-based measurement, the cutoff wavelength, the single measuring distance and the evaluation length are determined as a function of the surface properties on the basis of a table (see Figure 3). For this purpose, the expected texture parameters are first estimated and then test measurements are performed. There is no comparable table for areal measurement, but it is recommended to choose the same or similar values as a basis for test measurements. The amplitude and height parameters frequently used in practice have largely been extended to areal evaluation in the newer standard. Here, the areal measurement and evaluation of the topography has the advantage that it does not depend on the choice of measurement position and thus - especially in the case of inhomogeneous or defective surfaces - provides more reliable results (see Figure 3).
Characteristics in surface metrology
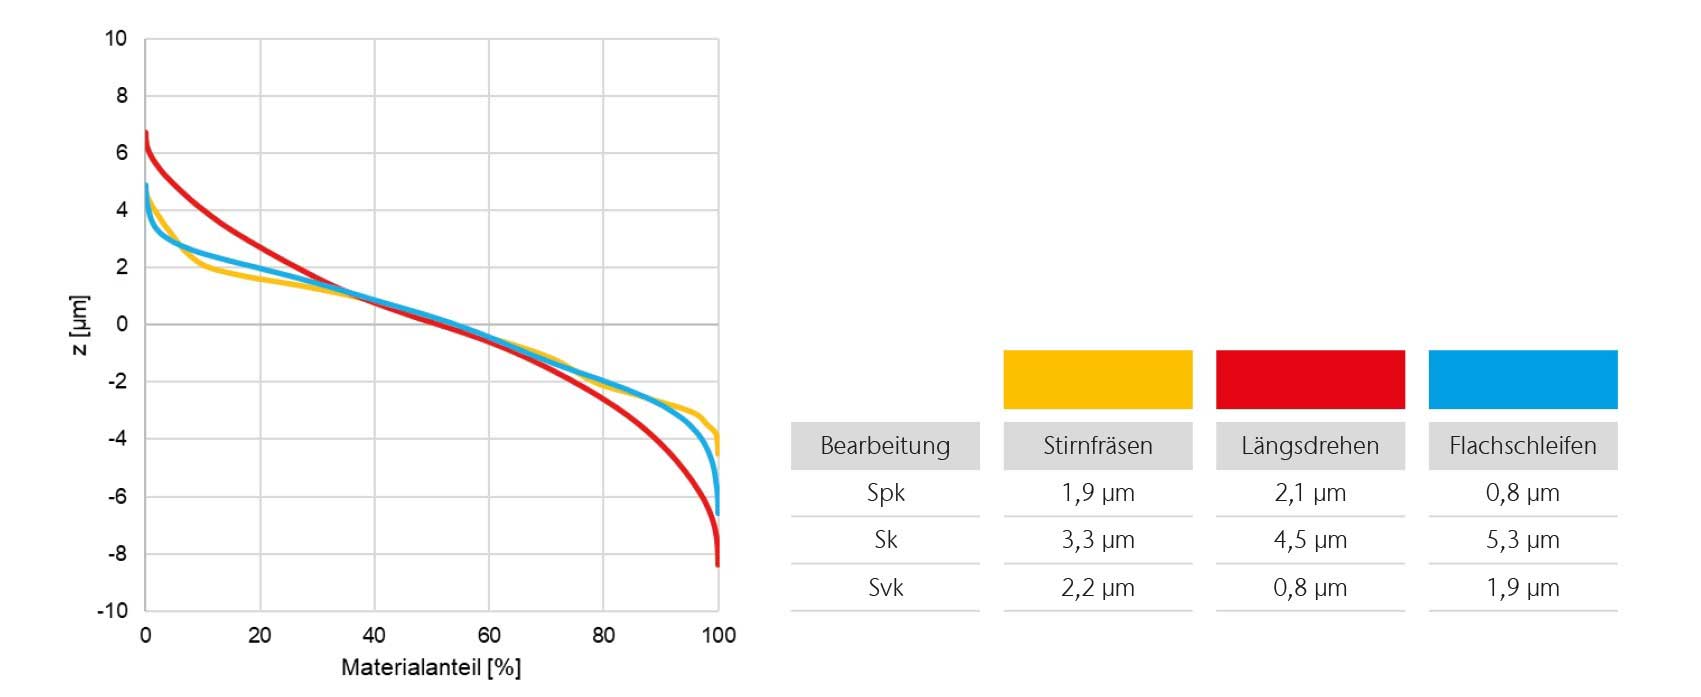
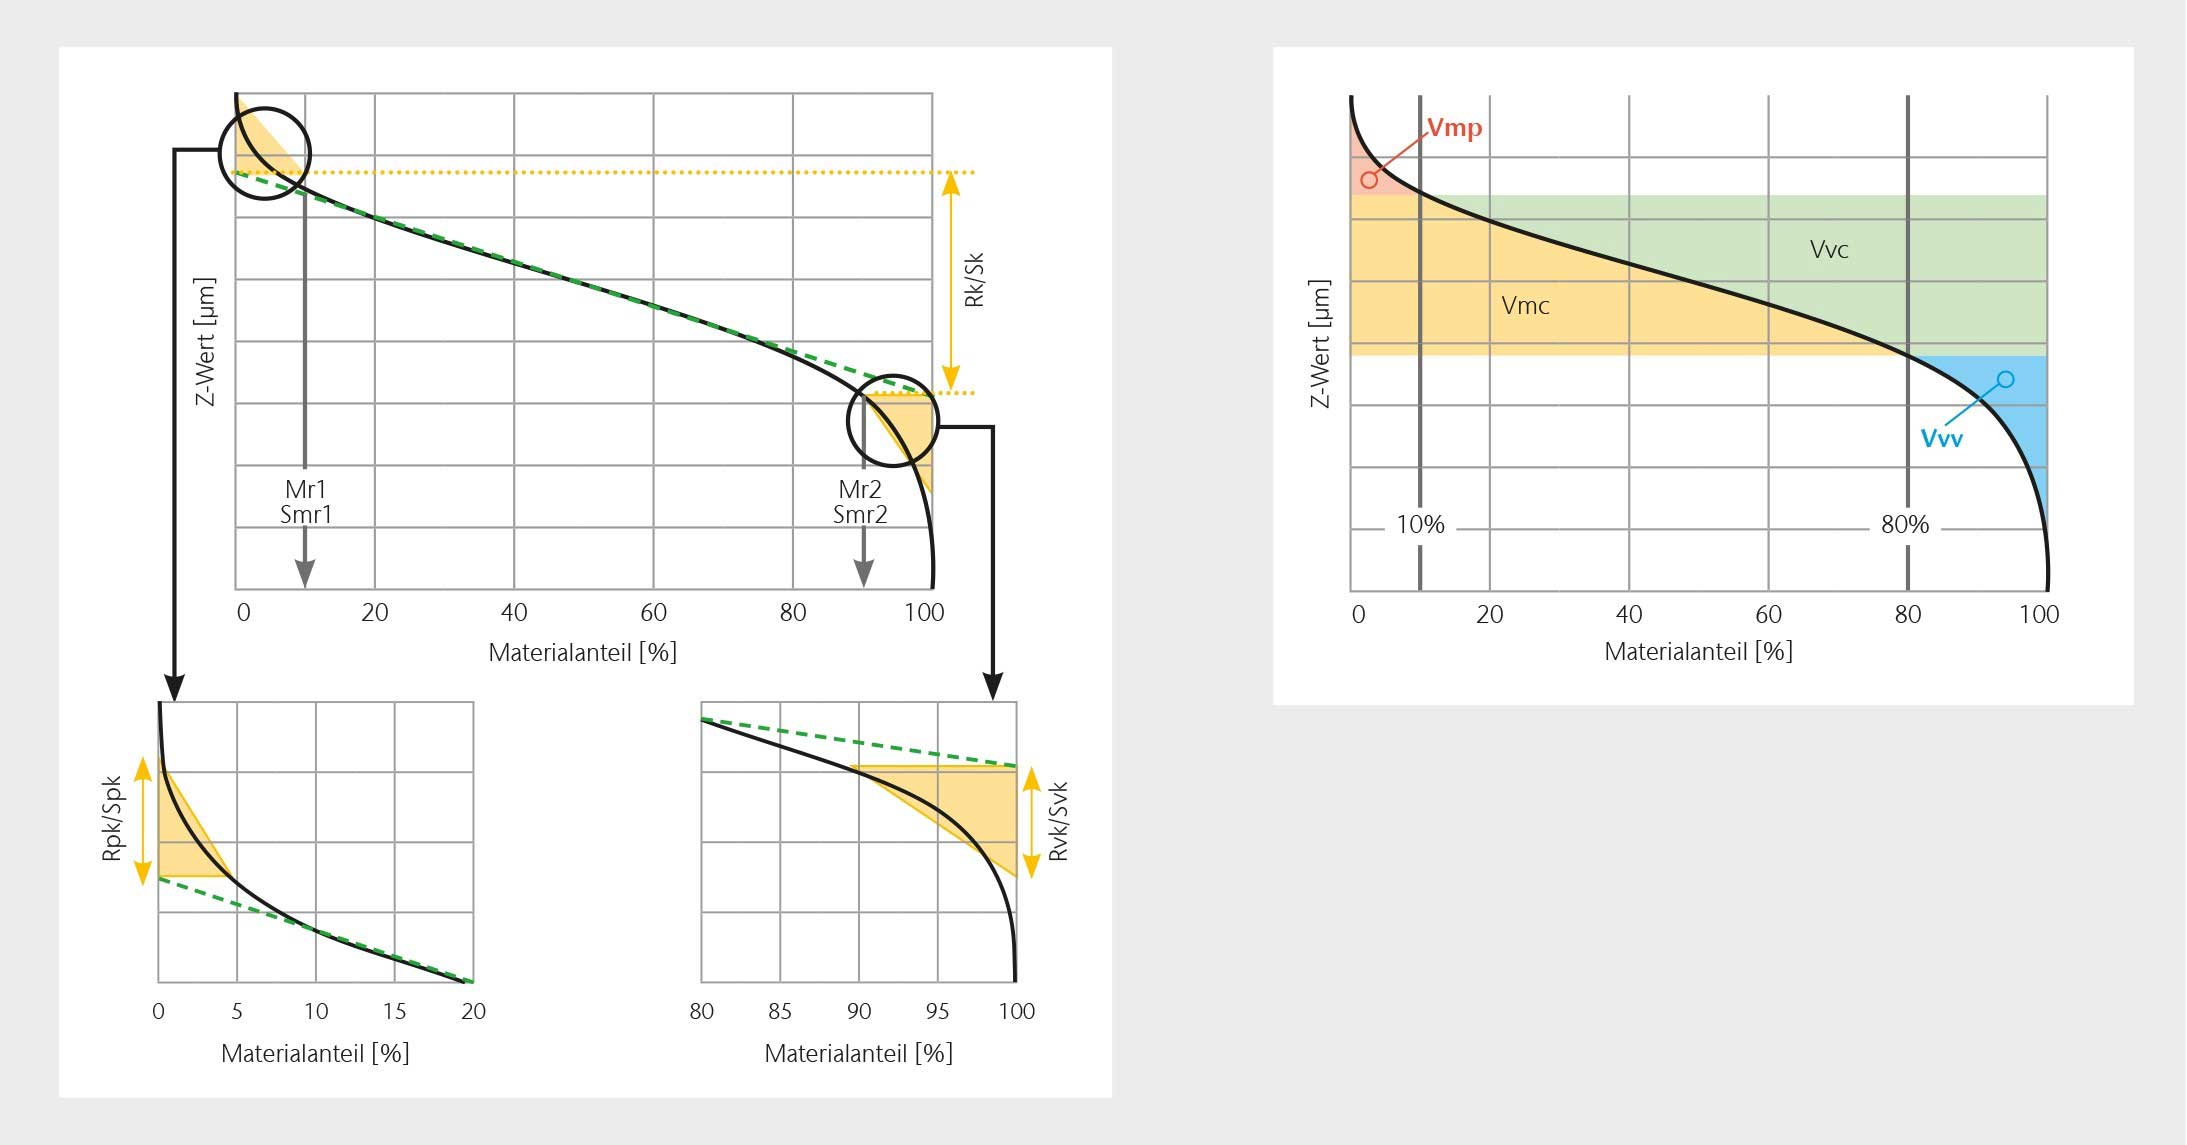
For the large number of characteristic quantities from the profile standards ISO 4287 and ISO 13565, an equivalent can be found in the newer surface standard ISO 25178. Beyond this, however, the surface-based evaluation of the topography offers additional possibilities due to the added dimension, which allow a function-oriented evaluation of the surface. Material proportion curves based on data determined by area, for example, make it possible to describe the functional behavior of a surface. In addition, further evaluations based on material volume or topography parameters can provide additional insights. In summary, it can be said that the profiled 2D surface measurement technique will probably only continue to be useful in the medium term where its informative value is sufficient. Area-based characterization of the surface using optical 3D measurement technology offers considerably more possibilities. Measuring equipment should therefore be supplemented or replaced at the latest when 2D parameters can no longer describe the characteristics or function of a surface with sufficient accuracy or only unreliably. In such cases, three-dimensional optical measurement technology not only provides a function- and structure-oriented evaluation, but also an image of the surface that is easier for human perception to understand. As a laser technology pioneer, Polytec has been providing optical metrology solutions for research and industry since 1967. After the early years as a distributor, the company started developing its own laser-based measuring instruments in the 1970s and is now a leader in the field of non-contact vibration measurement technology with laser vibrometers.
Info: Polytec GmbH
www.polytec.com
Pictures and graphics: Polytec